[ 01 ]
Data Curation
We meticulously collect and refine open datasets with surgical precision, ensuring quality and relevance before any analysis begins. This foundation of high-quality data is essential for discovering meaningful connections.
We synthesize Italian open data into high-fidelity lenses for solar development, real estate, and climate-risk assessment.
Raw data is plentiful but unusable. We transform isolated regulatory and geographic sets into actionable territorial intelligence for Italian market leaders.
01 — Our Approach
A repeatable method for turning raw open data into a connected, decision-ready knowledge layer.
We meticulously collect and refine open datasets with surgical precision, ensuring quality and relevance before any analysis begins. This foundation of high-quality data is essential for discovering meaningful connections.
Our proprietary graph algorithms identify complex patterns and relationships that traditional analysis methods simply cannot see, revealing the hidden value that exists between data points rather than within them.
We transform these connections into dynamic knowledge graphs that continuously evolve and enrich themselves automatically, creating an ever-expanding ecosystem of interconnected insights.
02 — Our Technology
Four engineering choices that compound: better signal, better structure, better foresight.
Custom algorithms operate on graph structures to uncover complex relationships that remain invisible to conventional analysis.
Self-evolving knowledge representations that grow more valuable over time, creating an interconnected web of insights.
AI that doesn't just analyze data — it comprehends contexts, interprets semantic relationships, and predicts potential connections.
We identify potential relationships before they fully emerge in the data, giving you an edge in anticipating trends and opportunities.
The Difference
While conventional tools analyze data in isolation, Dotlink focuses on the intersections where true value emerges. We don't just process data — we reveal the hidden relationships that drive groundbreaking insights.
We transform the abundance of open data into the 21st century's most precious resource: applicable knowledge. Our solutions convert raw information into actionable intelligence.
Our systems continuously learn and adapt, making connections more sophisticated over time. Each new dataset enriches the entire knowledge ecosystem.
In Practice
Where the connected-data approach has already shipped value across industries.
Executives connect market trends, competitor actions, and internal performance data, revealing strategic opportunities invisible to traditional analytics.
R&D teams discover unexpected connections between research fields, accelerating innovation by revealing cross-disciplinary insights.
Financial institutions identify subtle relationship patterns indicating potential risk or fraud that traditional monitoring systems miss.
Marketing strategists identify emerging customer needs and market gaps before they become obvious to competitors.
We applied Dotlink's connected-data approach to Italy's territory: 15+ official open datasets — each an island — fused into a single navigable knowledge layer. One engine, multiple lenses.
One engine · Multiple lenses
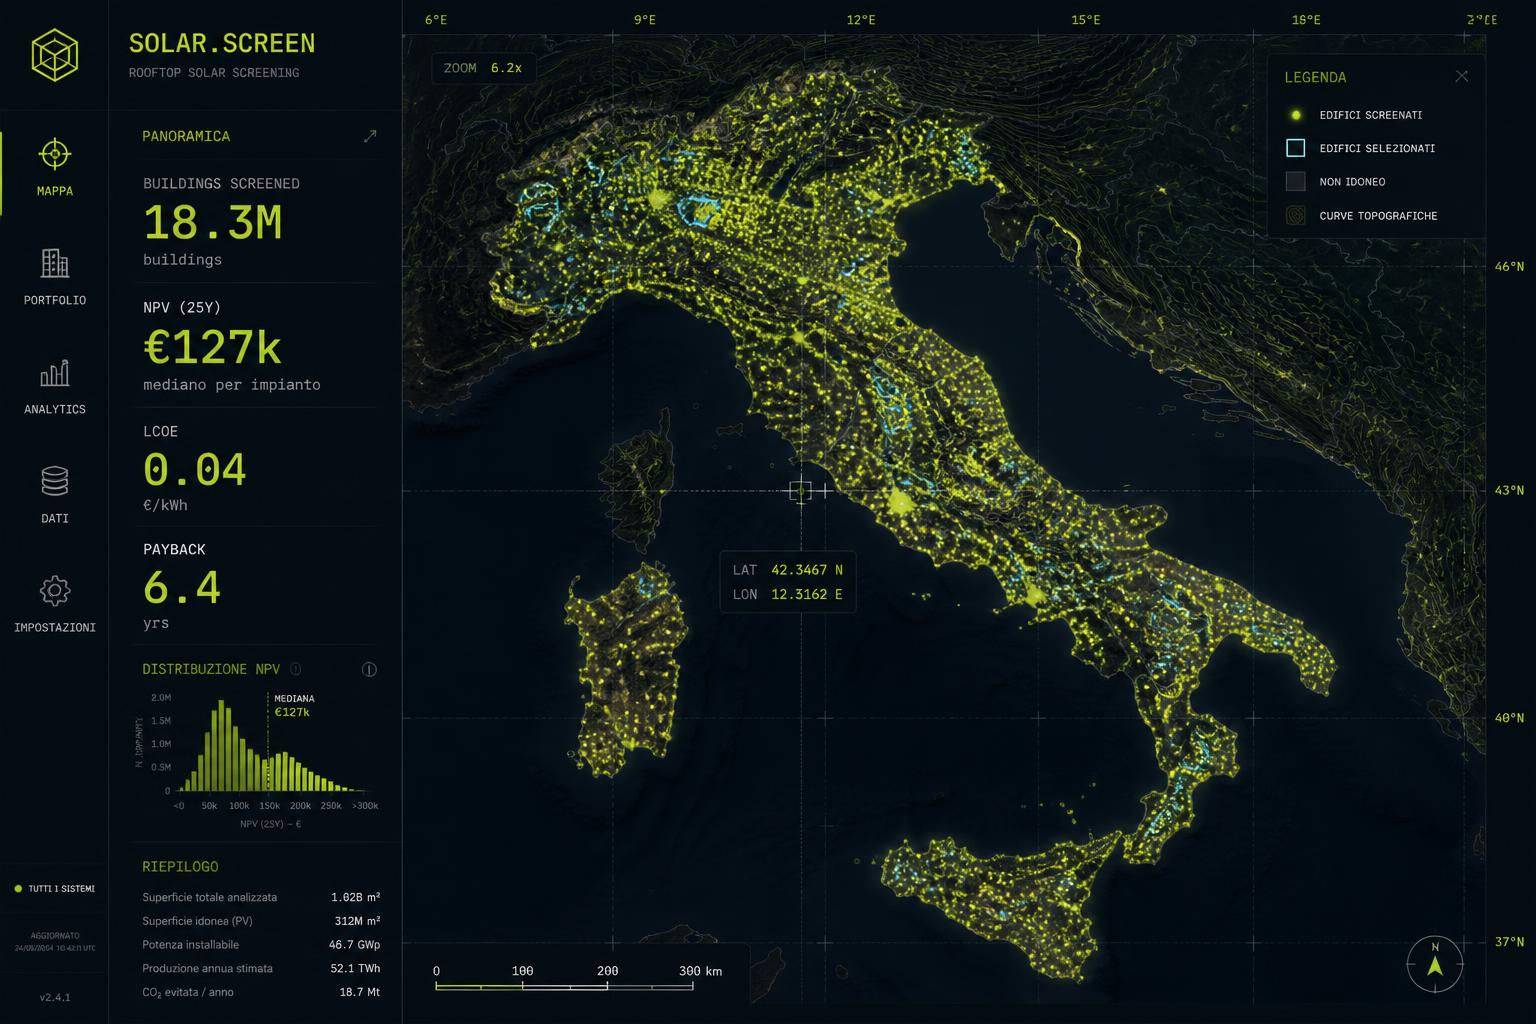
National solar-opportunity screening down to the individual building: 18.3M building footprints scored on irradiance (PVGIS), land availability (Copernicus), grid proximity and constraints. Transparent Solar Opportunity Score, plus per-building economics (payback, 20-year NPV, LCOE, 50% tax deduction) and renewable-energy-community (CER) scenarios.
Residential investment screening across municipalities: a transparent Prospect Score built from soil sealing, tree cover, population growth and accessibility, validated against official OMI market prices. Value-investing logic for territory: strong fundamentals, price not yet reacted.
Hydrogeological (ISPRA) and seismic (INGV) risk layers overlaid on the same base — so opportunity and exposure live in one decision surface, not in separate reports.
Built on official open data
Curated, normalised, cited — no black box.
By the numbers
national coverage
building footprints scored
every score is decomposable and explainable
fast, resilient, low-cost delivery
Showcase · Solar
Solar Prospect screens every building in Italy, then drills into per-rooftop economics — payback, 20-year NPV, LCOE, tax deduction, CER scenarios. The same engine, from continent to keystone.
Explore the live map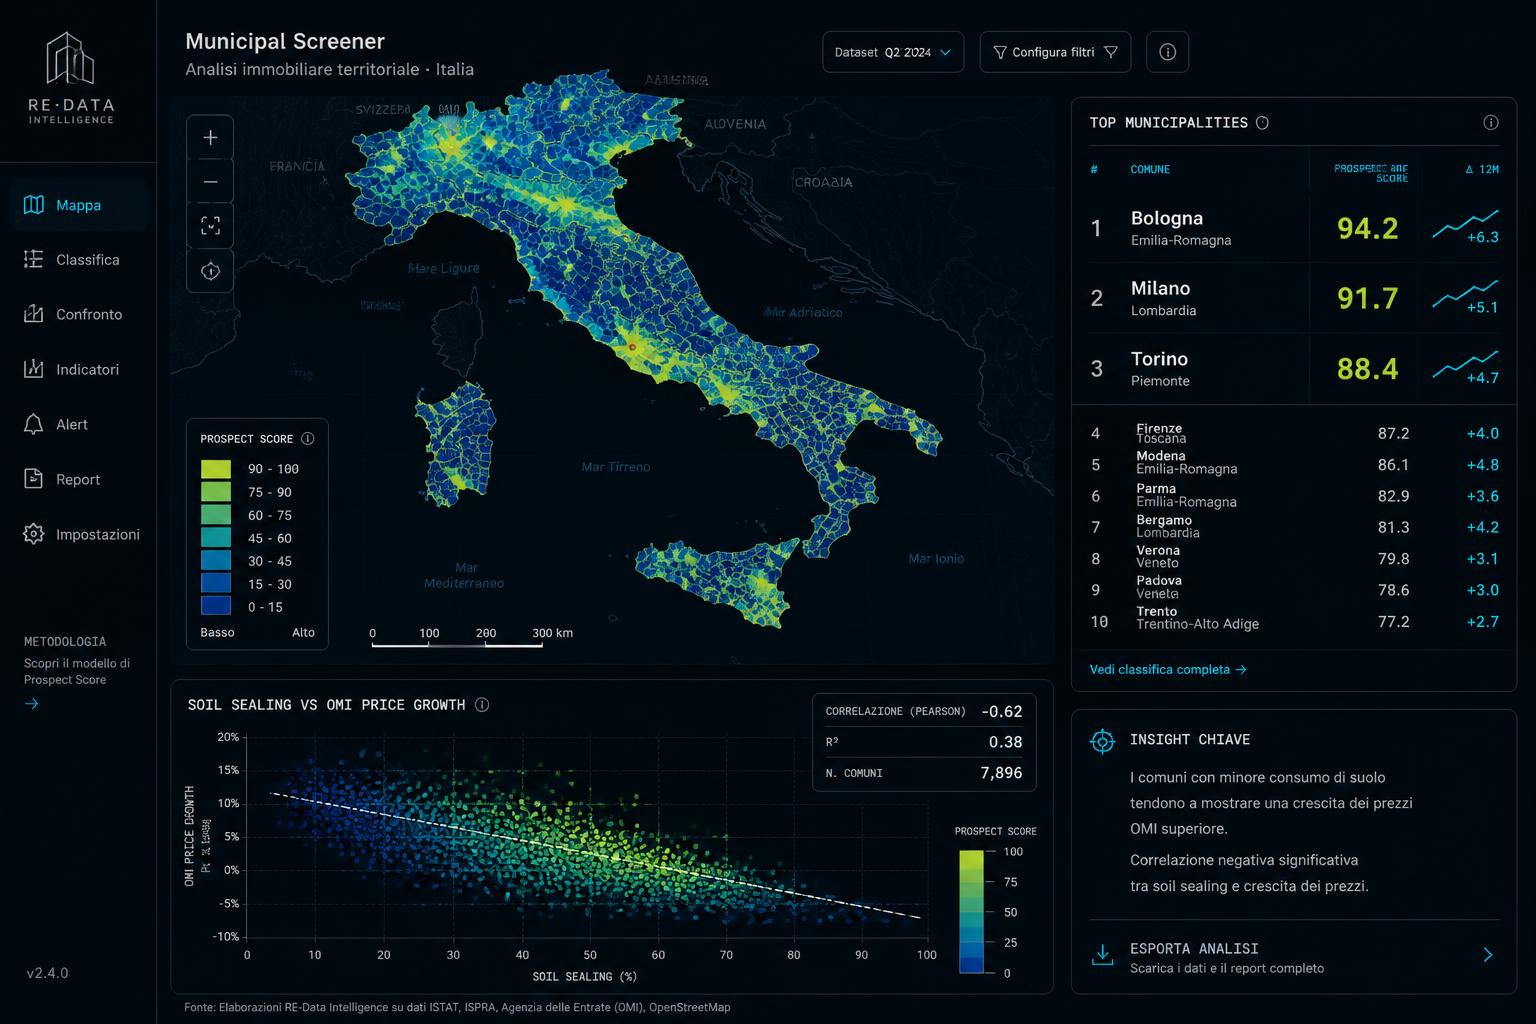
Showcase · Real Estate
Urban Prospect ranks 7,896 Italian municipalities on a transparent Prospect Score — soil sealing, tree cover, population growth, accessibility — and cross-checks it against official OMI market prices to surface value-investing opportunities.
See the screenerWho it's for
Bring your scenario — solar, real estate, risk — and we'll run it on the live engine during the demo.
Book a Demo03 — Implementation
From data assessment to integrated insights — a four-step path designed for production.
We evaluate your existing data landscape and identify the open datasets that will add the most value to your specific business challenges.
We build a specialized knowledge graph architecture for your industry, incorporating both your proprietary data and curated open datasets.
Our proprietary algorithms identify the meaningful relationships within your data ecosystem, focused on your strategic priorities.
Discovered connections are integrated into your decision-making with dashboards and alerts that route insight to the right stakeholders.
04 — Start here
Four steps from first conversation to ongoing partnership.
A discovery session where our experts learn about your challenges and explain how the connection-focused approach can transform your data strategy.
A targeted demonstration using a sample of your data combined with our curated open datasets — see invisible connections become actionable insights.
We design and deploy a tailored solution that integrates seamlessly with your existing systems and workflows, with minimal disruption.
As your business evolves, your Dotlink system evolves — continuous discovery, optimization, and support to maximize value over time.
Bring us your hardest data fragmentation problem. We'll show you what connection looks like — with real data, on real territory.